 Loading Please Wait...Loading Please Wait...
This blog will teach you how to implement morris js and show dynamic data in some form of graphs or charts. We can use morris js for a bar chart, line chart, pie chart, etc.
First of all, you need to include library js, CSS and other required files like jquery into your page.
 <link rel="stylesheet" href="//cdnjs.cloudflare.com/ajax/libs/morris.js/0.5.1/morris.css">
 <script src="//ajax.googleapis.com/ajax/libs/jquery/1.9.0/jquery.min.js"></script>
 <script src="//cdnjs.cloudflare.com/ajax/libs/raphael/2.1.0/raphael-min.js"></script>
 <script src="//cdnjs.cloudflare.com/ajax/libs/morris.js/0.5.1/morris.min.js"></script>
Now we will add javascript code to make it work
new Morris.Line({
// ID of the element in which to draw the chart.
element: 'myfirstchart',
// Chart data records -- each entry in this array corresponds to a point on
// the chart.
data: [
// WE CAN USE SOME DYNAMIC DATA HERE FROM DATABASE USING PHP OR SOME OTHER LANGUAGES
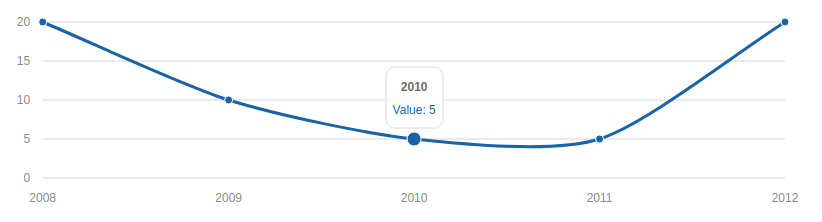
{ year: '2008', value: 20 },
{ year: '2009', value: 10 },
{ year: '2010', value: 5 },
{ year: '2011', value: 5 },
{ year: '2012', value: 20 }
],
// The name of the data record attribute that contains x-values.
xkey: 'year',
// A list of names of data record attributes that contain y-values.
ykeys: ['value'],
// Labels for the ykeys -- will be displayed when you hover over the
// chart.
labels: ['Value']
});Now to show this thing on the front end we need to embed it with HTML so for that, we will take div and give it ID myfirstchart
<div id="myfirstchart" style="height: 250px;"></div>Morris JS chart Graphs Result of this will be something like this.
(Reference: morrisjs.github.io)